


The basics of the scatter plot
The scatter plot provides valuable information about the measurements as an additional source of information. The scatter plot is a two-dimensional representation of two consecutive time intervals of the R-waves (heartbeats). However, the time intervals (measured in milliseconds) are converted into pulse values to make the graph more understandable.
How the scatter plot works
The procedure is as follows:

A series of the time intervals of the heartbeats is generated, this is duplicated and shifted down by one value. In this way, "pairs of values" are created for a measurement (formed by a distance between two heartbeats and the next distance in each case), which then result in a point as x and y values in the graph.

The point cloud is generated only from the first part of the measurement (i.e. with spontaneous breathing). The value of HRV is also calculated from this portion. The rhythmic fluctuations of the pulse (heart-breath coupling) generated by the breathing during the breath specification usually create an elliptical shape of the point cloud, which we do not display in the portal, however.

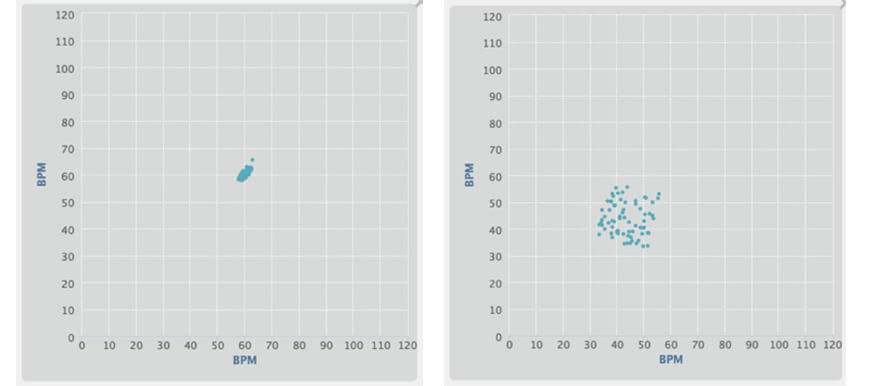
Stable measurements (i.e. qualitatively clean measurements) then draw a homogeneous plot (upper image). Pulse fluctuations, on the other hand, significantly lengthen the plot and provide a somewhat higher HRV due to the differences in heart rate.
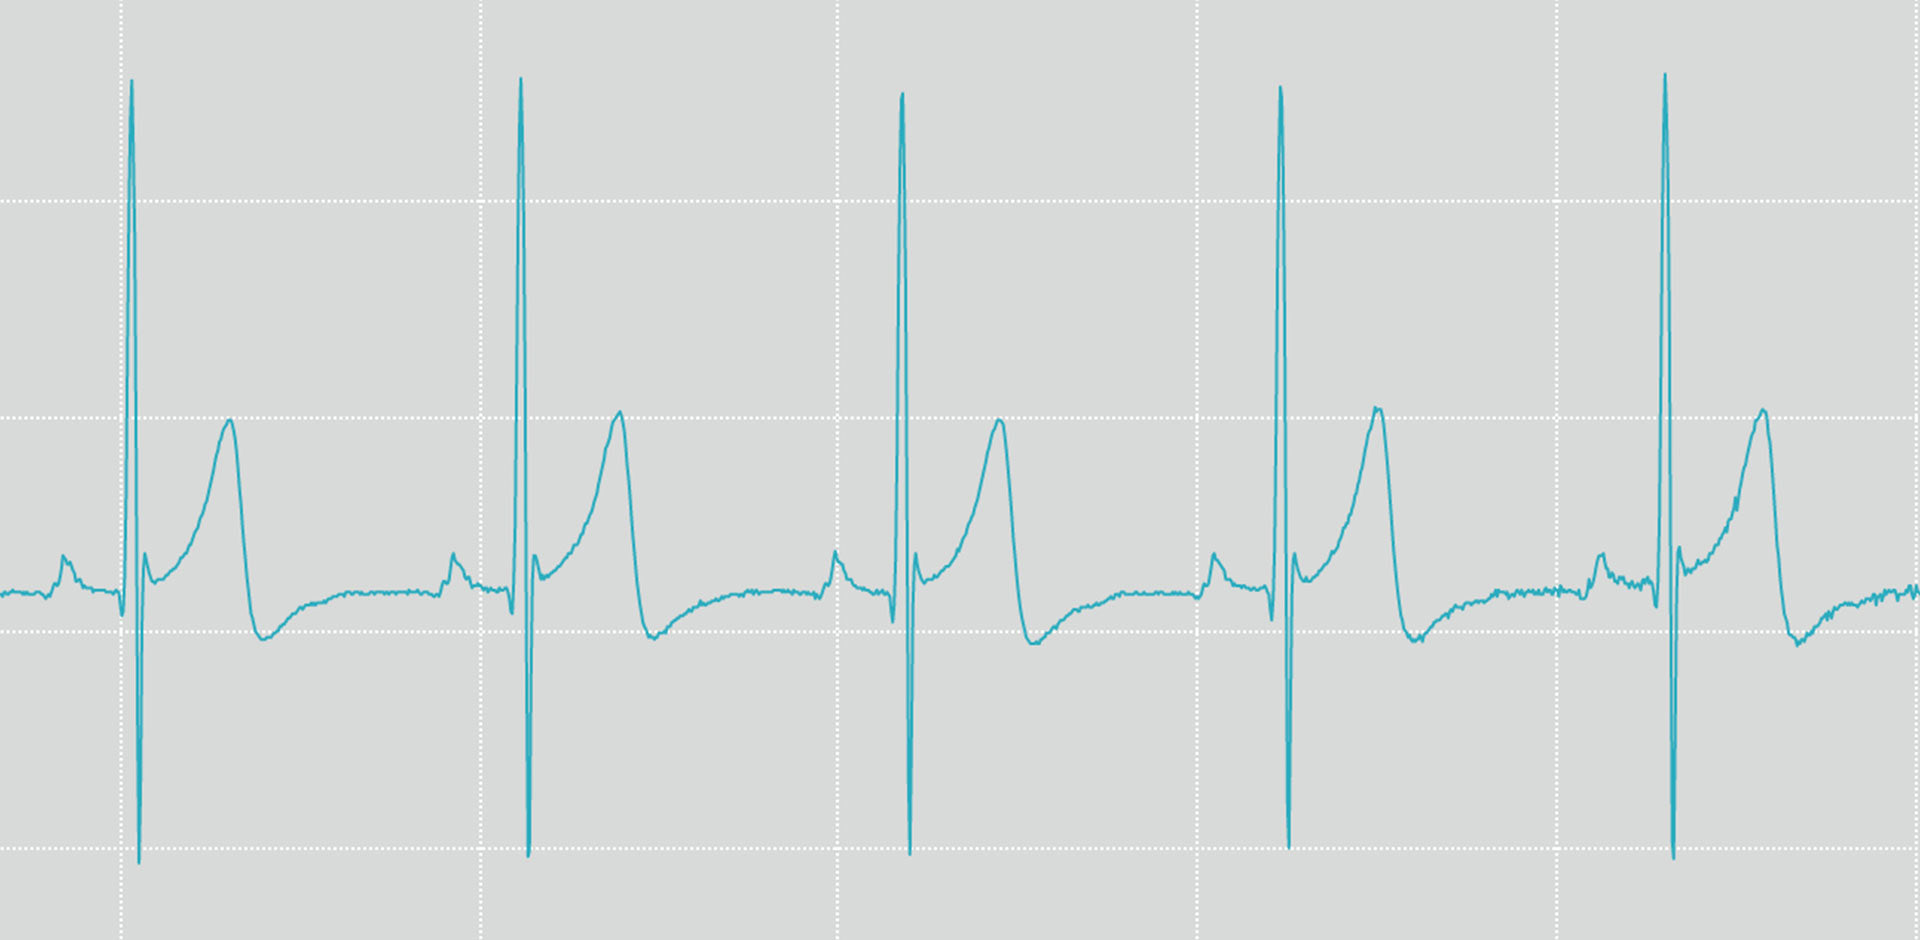
Another source of error is unclean measurements. Outliers, inconsistencies or extrasystoles can falsify the measurements if they occur too frequently in a measurement. These are clearly recognizable in the course as well as in the scatter plot. If up to a percentage of about 15% of the RR intervals are affected, then we can clean them up automatically. Any falsifications of a measurement that go beyond this cannot be cleaned up and must be deleted. The first indication is an unusually high HRV for an organism (values above 100msec should generally be checked -> history, plot, ECG ...).

Extrasystoles, i.e. heartbeats that fall completely out of an individual norm in their sequence because they are triggered too early, can also be corrected by up to approx. 15%. If these occur extremely frequently, the measurement must be discarded. In the example above we find 1 extrasystole, but the example below has permanent extrasystoles!!! Here, a calculation of the HRV cannot be made sensibly!


Information from the scatter plot
From a clean measurement we can derive an interpretation based on the individual size of the plot. Individually high scattering provides different information than an - individually seen - small plot:
If the HRV plot (individually seen) is very invariable, then the following factors may apply:
- Exhaustion from work or training
- Overreaching / overtraining / burn out
- illness (immune system reacts) or acute pain
- extreme temperatures, altitude conditions or jet lag
- Stress, depression, mental illness, etc.
- malnutrition or nutritional deficiencies, intolerances
- alcohol consumption
- insufficient sleep (deviating from the individual "norm")

If the HRV plot (individually seen) is large, then the following factors are usually decisive for this:
- good state of recovery
- sufficient regeneration through sleep
- short recovery through euphoria or coupling of the heartbeat to the respiration through aerobic endurance training in the post-exercise period
- optimal nutrition
- health
- no tension

If your plot doesn't reach the size of the plot shown above - don't worry, that one has 220msec and only very few people reach that!!!
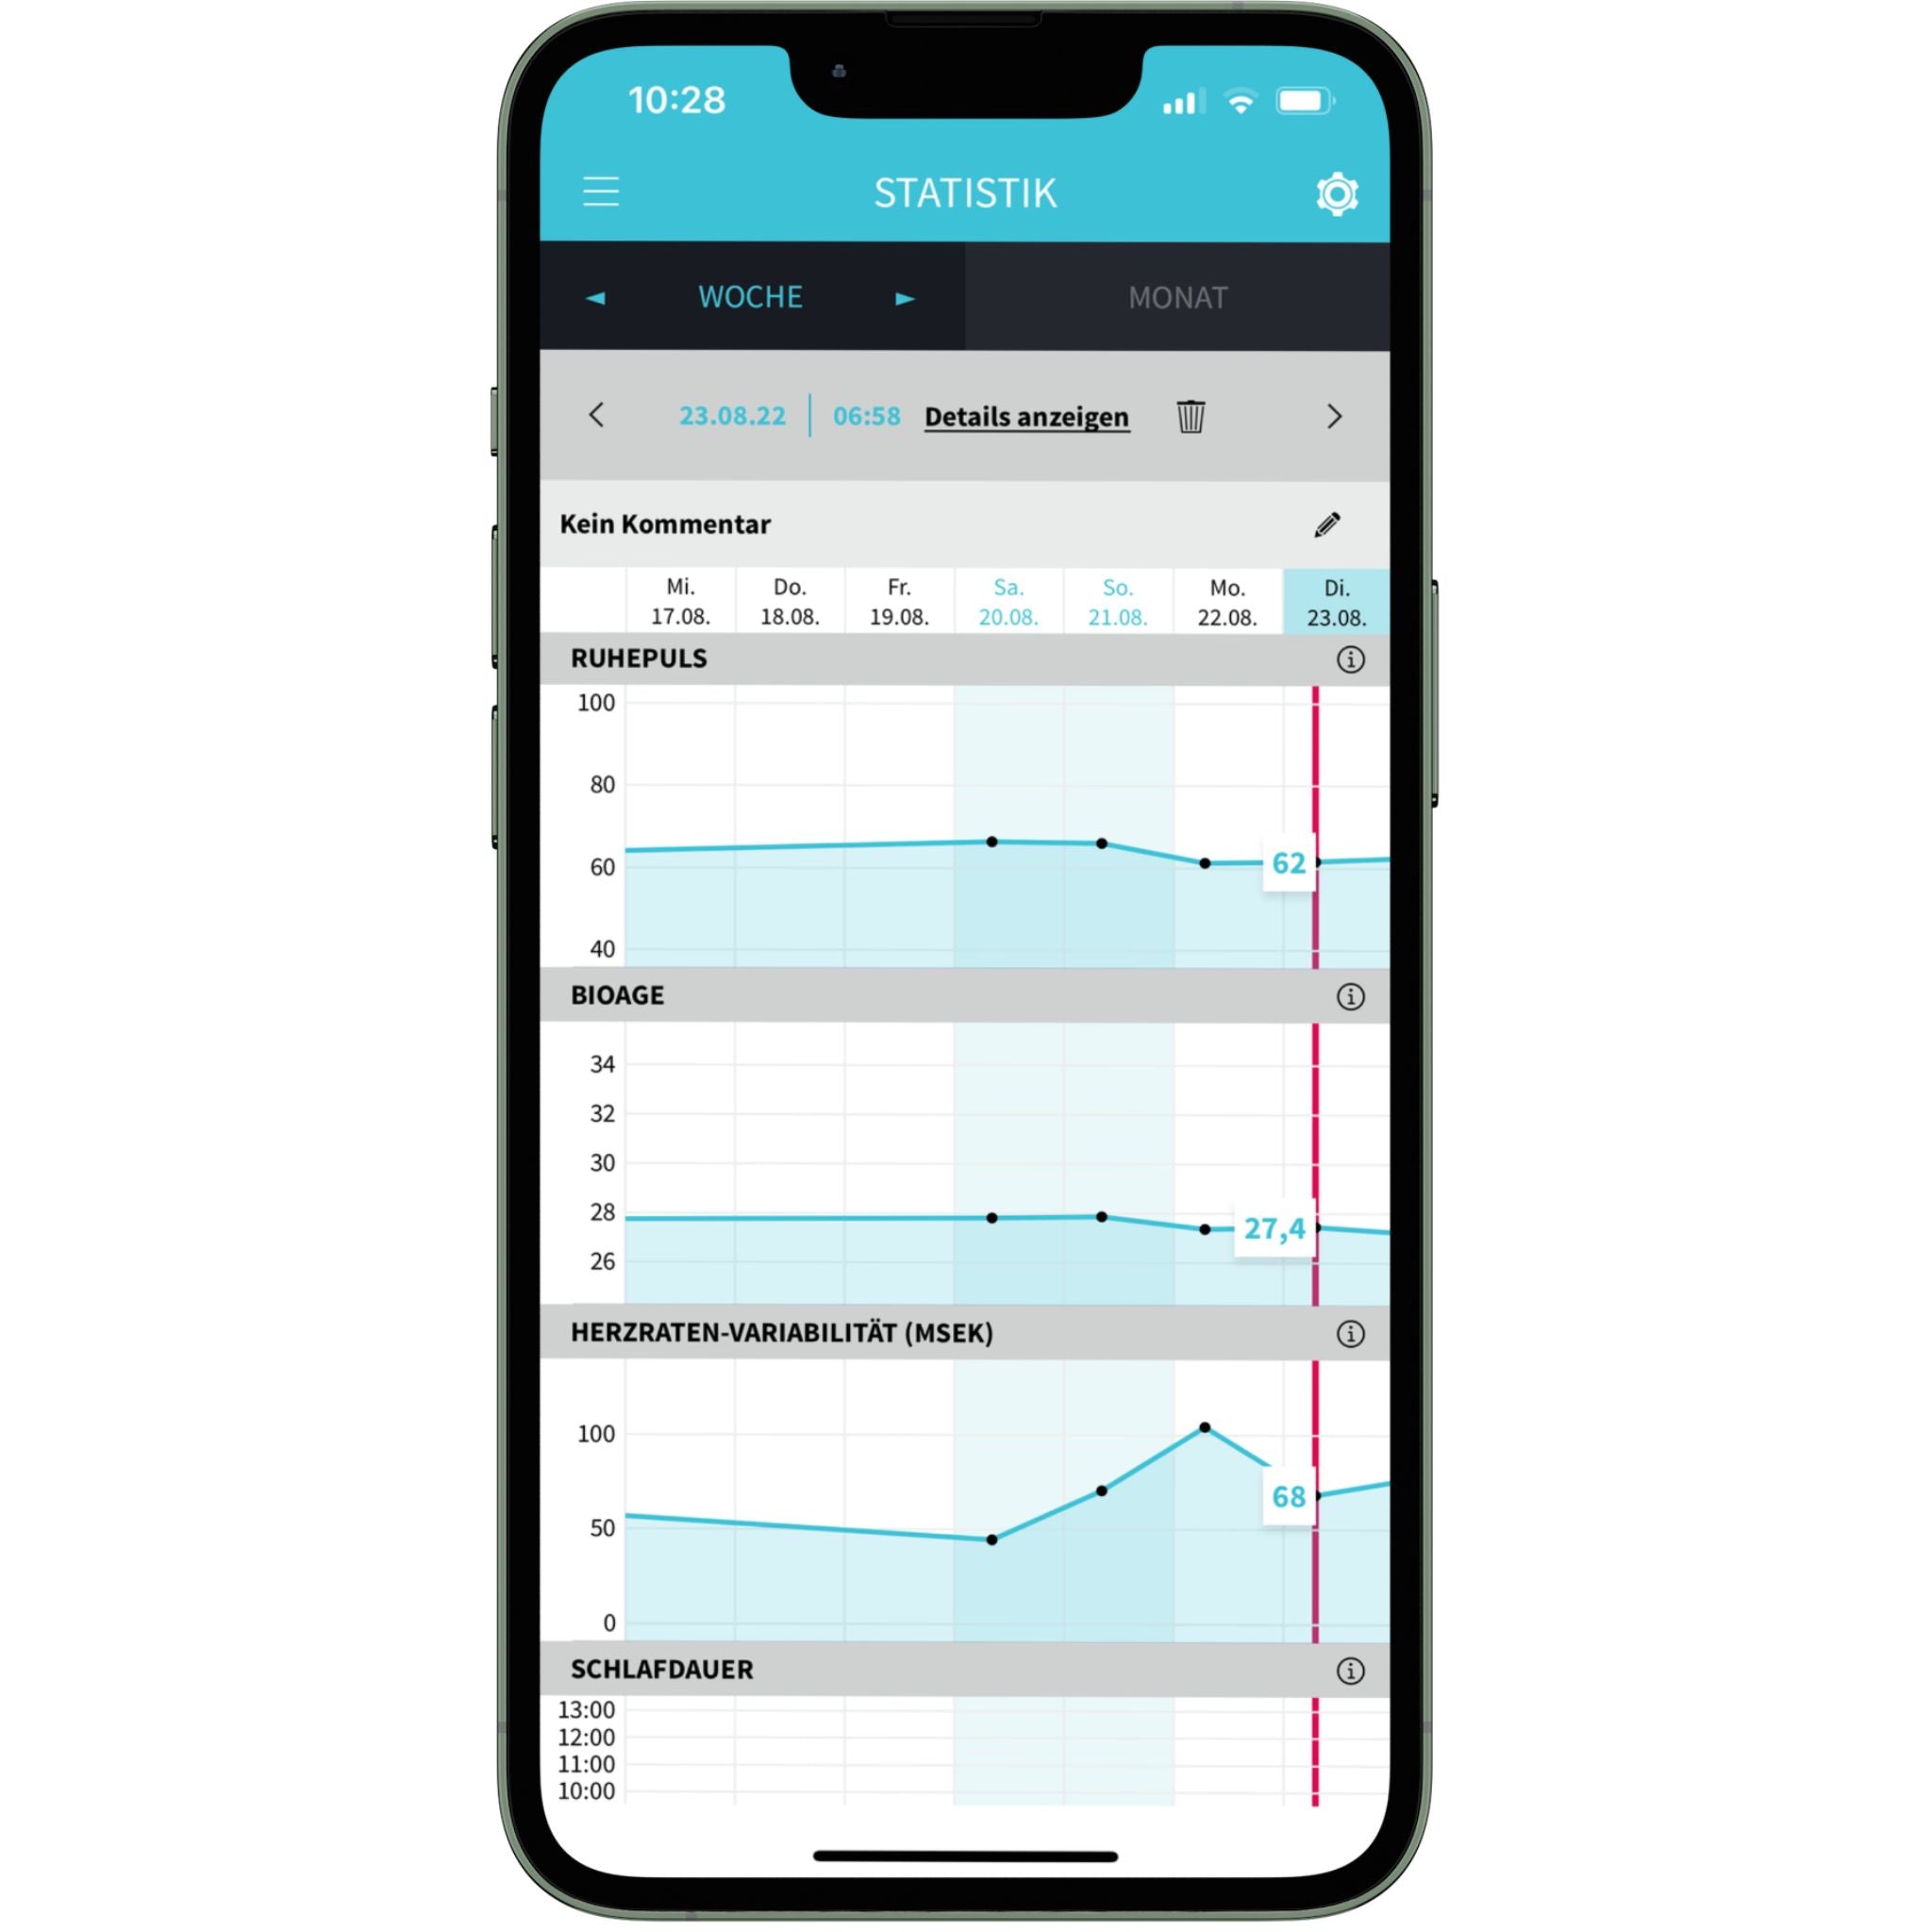
Resting pulse as a source of information
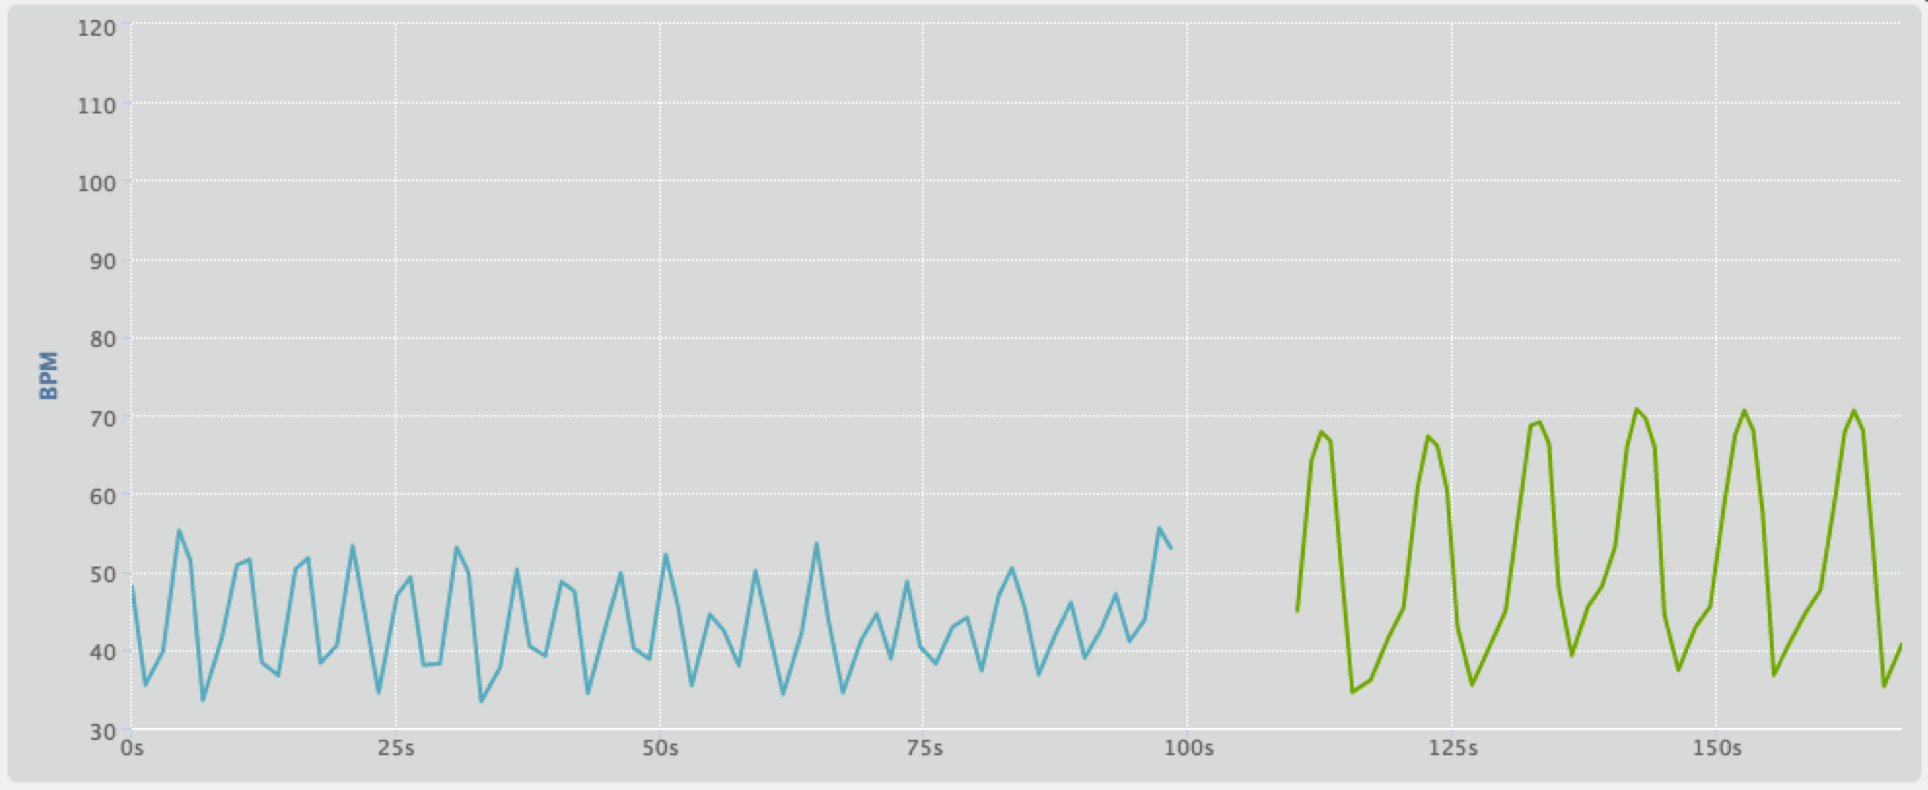
Why don't we use the resting pulse as a source of information for training control - as we did in the past? The level of the pulse is an average information, which reflects only very inaccurately the load capacity! The example below shows the differences in the load capacity of one and the same person with the same average pulse. The bottom line of the two measurements: Measurement left => interval training / measurement right => training break!

The pulse alone is unfortunately no longer useful nowadays!


Leave a comment
All comments are moderated before being published.
This site is protected by hCaptcha and the hCaptcha Privacy Policy and Terms of Service apply.